


What is the Normal Retirement Age?
Thursday, October 26, 2017 | Leave a comment
The last ten years of watching and helping seniors leave their careers for retirement has been quite an extraordinary time to be a part of. Not only are increasingly more people debating the decision to retire on a daily basis due to the baby boomer generation, but also the markets have shown some extremely volatile times from the Great Recession in 2008 followed by a multi-year recovery.
When I look back over the last few years, I’m reminded of the decisions people have made to retire at the traditional retirement age or delay retirement for various reasons. For some, a reason they had delayed was to recoup some of what they lost in 2008 in the Great Recession. For others, the decision to delay was simply because they were healthy and enjoyed working. In any case, the trend of people working more at older ages has been true in the U.S. for both men and women 50 and older in recent years.
The economic term that measures this trend is the Labor Force Participation Rate (LFPR). This equals the total of those working and looking for work divided by the total available workers not including those in the military or committed to an institution. Notice how the trend points downward after the turn of the century, but it is deceptive to take this at face value.
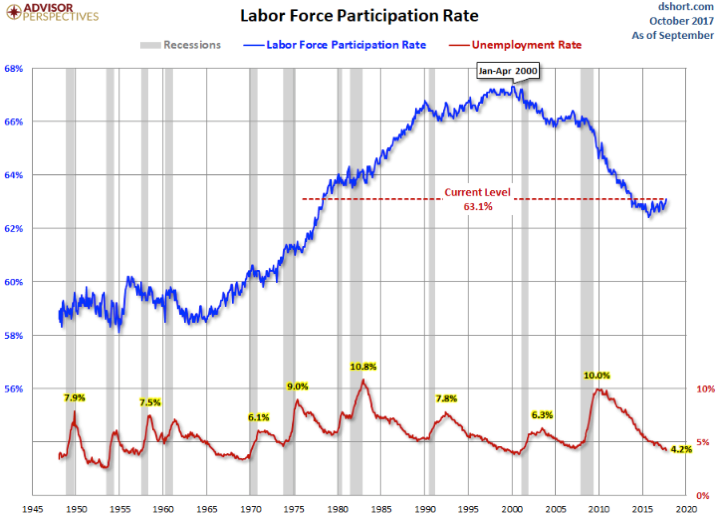
The LFPR had steadily increased from the mid 1960’s through the 1990’s, as women began to enter the work force in greater numbers. Then after the year 2000, the trend reversed. Not because baby boomers were retiring in greater numbers as they became eligible for Social Security—in fact the opposite is true. But because those in their prime working years (ages 25-54) have been leaving the workforce. For example, the LFPR for men during their prime working years had peaked at 98 percent in 1954, compared to just 88 percent today. Those in this age group with high school degrees or less have had the steepest decline.
If we look at just those 50 and older we see a different picture. The table below shows how the number of people employed per hundred in various age cohorts have changed since the year 2000. For those between age 60-64, there are currently 22% more in the work force, as compared to the year 2000. The number of those working between age 65-69 have increased 39% over the same period.

Source: www.dshort.com
With less young people working than before and more older folks working than before, the dynamics of the economy have certainly changed.
As with all my writing, I hope this has helped you in some way. If you are thinking about retirement and would like a helpful 5 step quick guide, click here.
Thank you for reading,
Nick