


How Are Asset Classes Doing?
Wednesday, December 3, 2014 | Leave a comment
When was the last time you turned on the television and saw a “Buy Gold Now” commercial? The good news is if you took advantage of those offers anytime before 2010, those shiny coins would be worth at least what you paid for them (not accounting for inflation). If purchased from 2011-2012, you will likely take a haircut if selling today.
Since the financial crisis market lows of 2009, many asset classes have seen steady positive performance. Most of those who held on to their equity positions during and after the financial crisis are now much better off. See the chart below to view how a hypothetical $100,000 would have grown in each of the listed asset classes if invested at the start of 2007 and held to today.
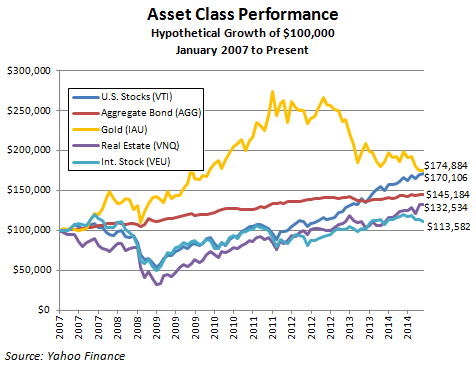
Despite gold’s lackluster performance since 2012, it has been the best performing asset class over this time period. The close 2nd place contender has been US Equities.
Of course, hindsight is 20/20. When deciding where to allocate funds today, we cannot access our crystal ball to determine what the best asset will be moving forward. Going “all in” the wrong asset class could derail one’s retirement goals.
So then the answer is diversifying, right? Yes, at least at the minimum. Often, when I am meeting with someone for the first time, I see a lot of holdings that give the impression portfolio is diversified, but after careful analysis I find the opposite is true. There may be many positions, but these positions are extremely correlated–they move and act like a single position. When investment positions are highly correlated, an investor receives little diversification benefit from holding more positions.
Beware, the next two paragraphs are very geeky:)
Just for an example, I’ve compared how closely some asset classes are correlated using historical asset price data from Yahoo Finance. Two positions that are quite common in portfolios I review are Large Cap Growth and Mid Cap Growth exchange traded funds. To illustrate these asset classes, I used the iShares IVW S&P 500 Large Cap Growth ETF and the iShares IWP Mid Cap Growth ETF. Using monthly return data from January 2007 to October 2014, I found they have a correlation of .96. (1.00 = perfect positive correlation and -1.00 = perfect negative correlation).
As a simple comparison, I also calculated the correlation between U.S. stocks and bonds during this same time period. For U.S. stocks I used the Vanguard Total Stock Market ETF (VTI) and for bonds I used the iShares Barclays Aggregate Bond Fund (AGG). The correlation dropped to .07, showing little to no correlation.
When a portfolio is truly diversified, risk goes down–your golden eggs are in many baskets.
After proper diversification, some of you reading might be asking if it makes sense to hold poor performing asset classes month after month, just to be diversified? Many money management firms run this way; however, we utilize an academically smart and automatic tactical approach that adjusts asset class weightings based on their relative strength and performance. In many of our strategies, this approach helps avoid poor performing asset classes, such as holding positions in gold for much of the time since 2012.
As I look forward to what the rest of this year and next year will bring, only time will tell what asset class outperforms. But regardless, having a properly diversified portfolio, at the minimum, will better help us mitigate the negative effects of a wayward asset class.
Thanks for reading,
Nick